Interest Rates and Bear Markets
How do interest rates affect Market Valuations?
It has been said many times that it is impossible to predict a bear market. Many on Wall Street spend enormous amount of time and money on this very activity. Although it may be difficult to predict the bear market one can evaluate the conditions that could lead to a bear market.
What do I mean by that?
Lets imagine a bridge that carries thousands of vehicles across from one end to another. Lets also suppose its a very old bridge, and there is some visible wear and tear on the bridge. Now by observing this, one can conclude the weakness of the bridge, but its impossible to know which vehicle will exactly cause the fall of the bridge. It could be any one of the thousands of vehicles that pass over it. Similarly, one can evaluate general conditions that precede a bear market, but its impossible to predict which one event will cause the start of the bear market.
One such tool in evaluating these conditions is the general interest rates in the economy. Lets see how rates have performed since 1998.
Interest rates since 1998
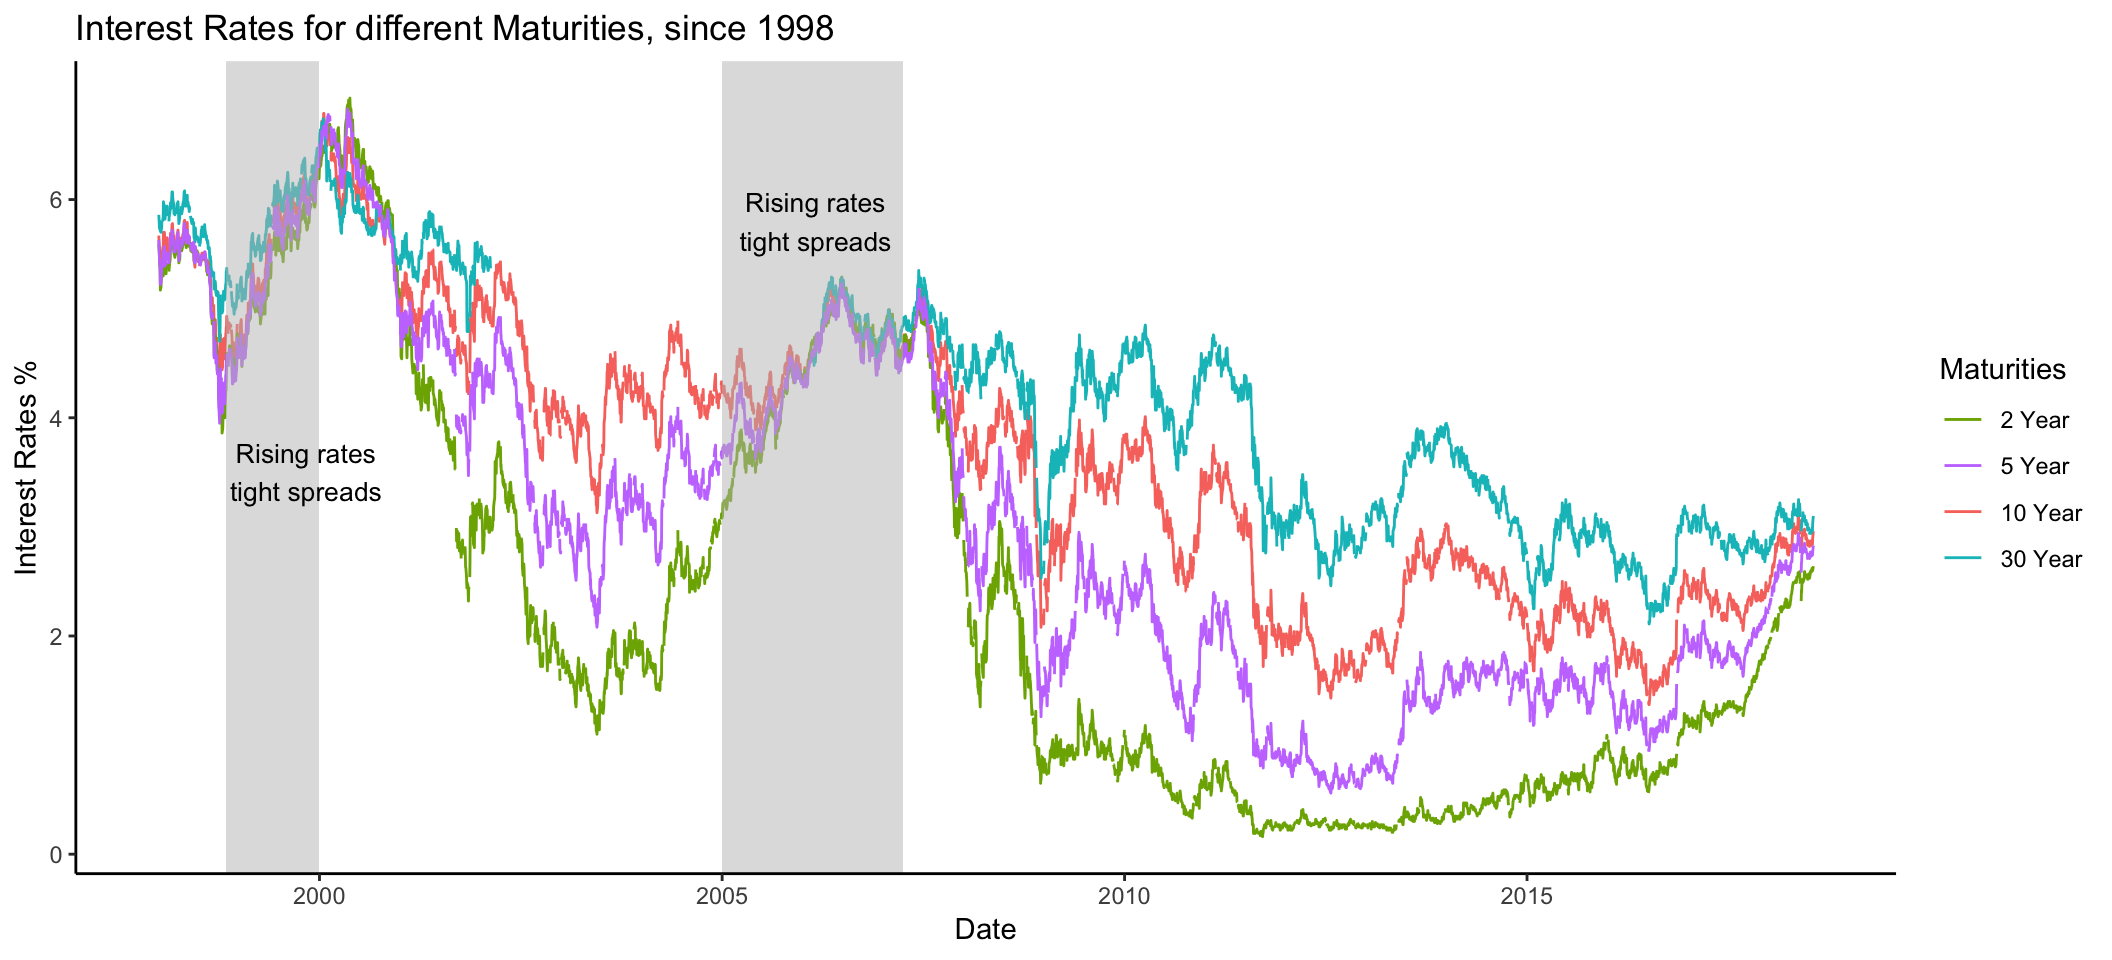
When we look at the above chart, we see that interest rates have been generally trending down since 2000. The 30 year interest rates dropped from 6% in 1998 to about 3.1% today. We can also see that usually there are big gaps in the interest rates for different maturities. This gap is called an interest rate spread. When interest rates are far from each other, we call this wide spread and when rates are close to each other we call this tight spreads. Since the summer of 2017, interest rates have been rising and spreads have been getting tight as we can see from the above chart.
I want to draw your attention towards the highlighted area. Here we can see that interest rates were rising and the spreads between rates was also getting tight. By looking at the date you may recall that this was the period preceding the last two major financial crisis. From 1999 to 2000, interest rates went up from 4% to 6%, similarly interest rates went up from 2% to 5% from 2004 to 2007. The spreads were also getting tighter during this period. After the crisis we can see interest rates fell and spreads started to widen again. When interest rates are falling and spreads are wide, that’s the best time to own stocks.
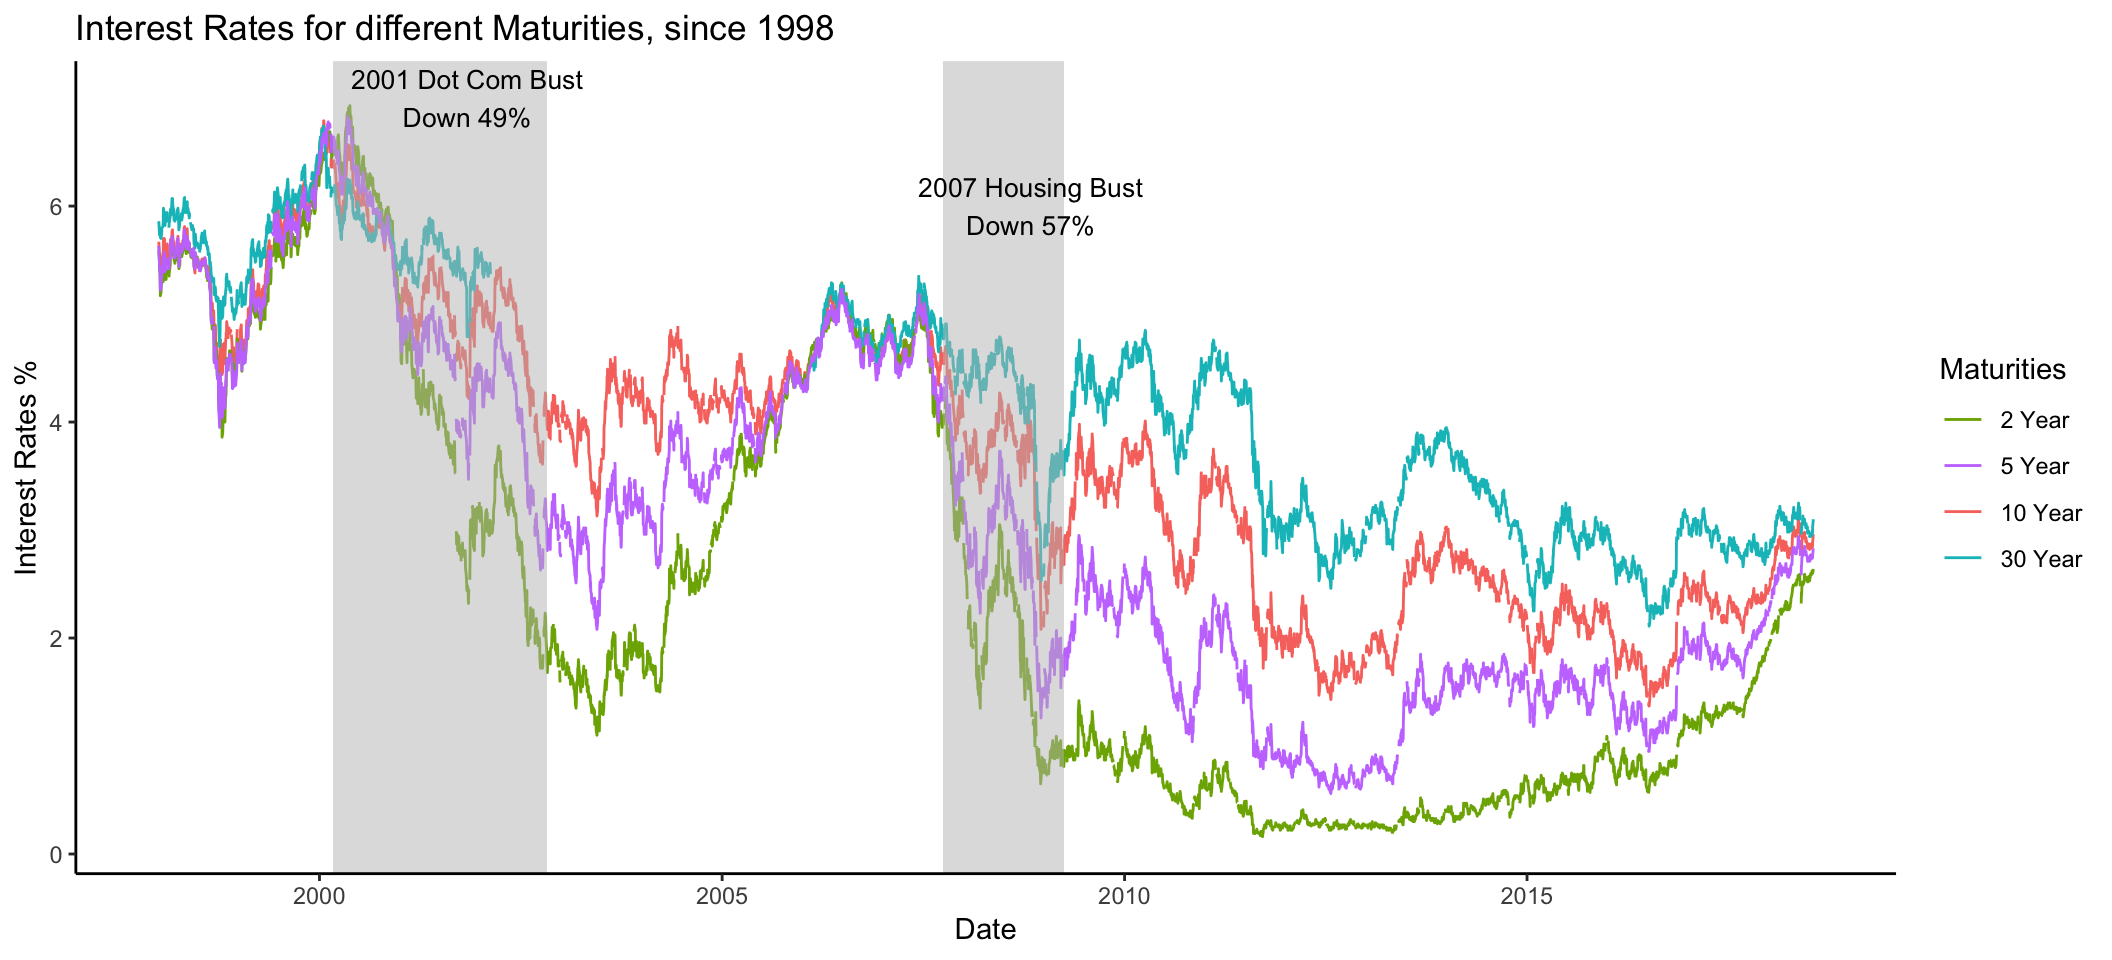
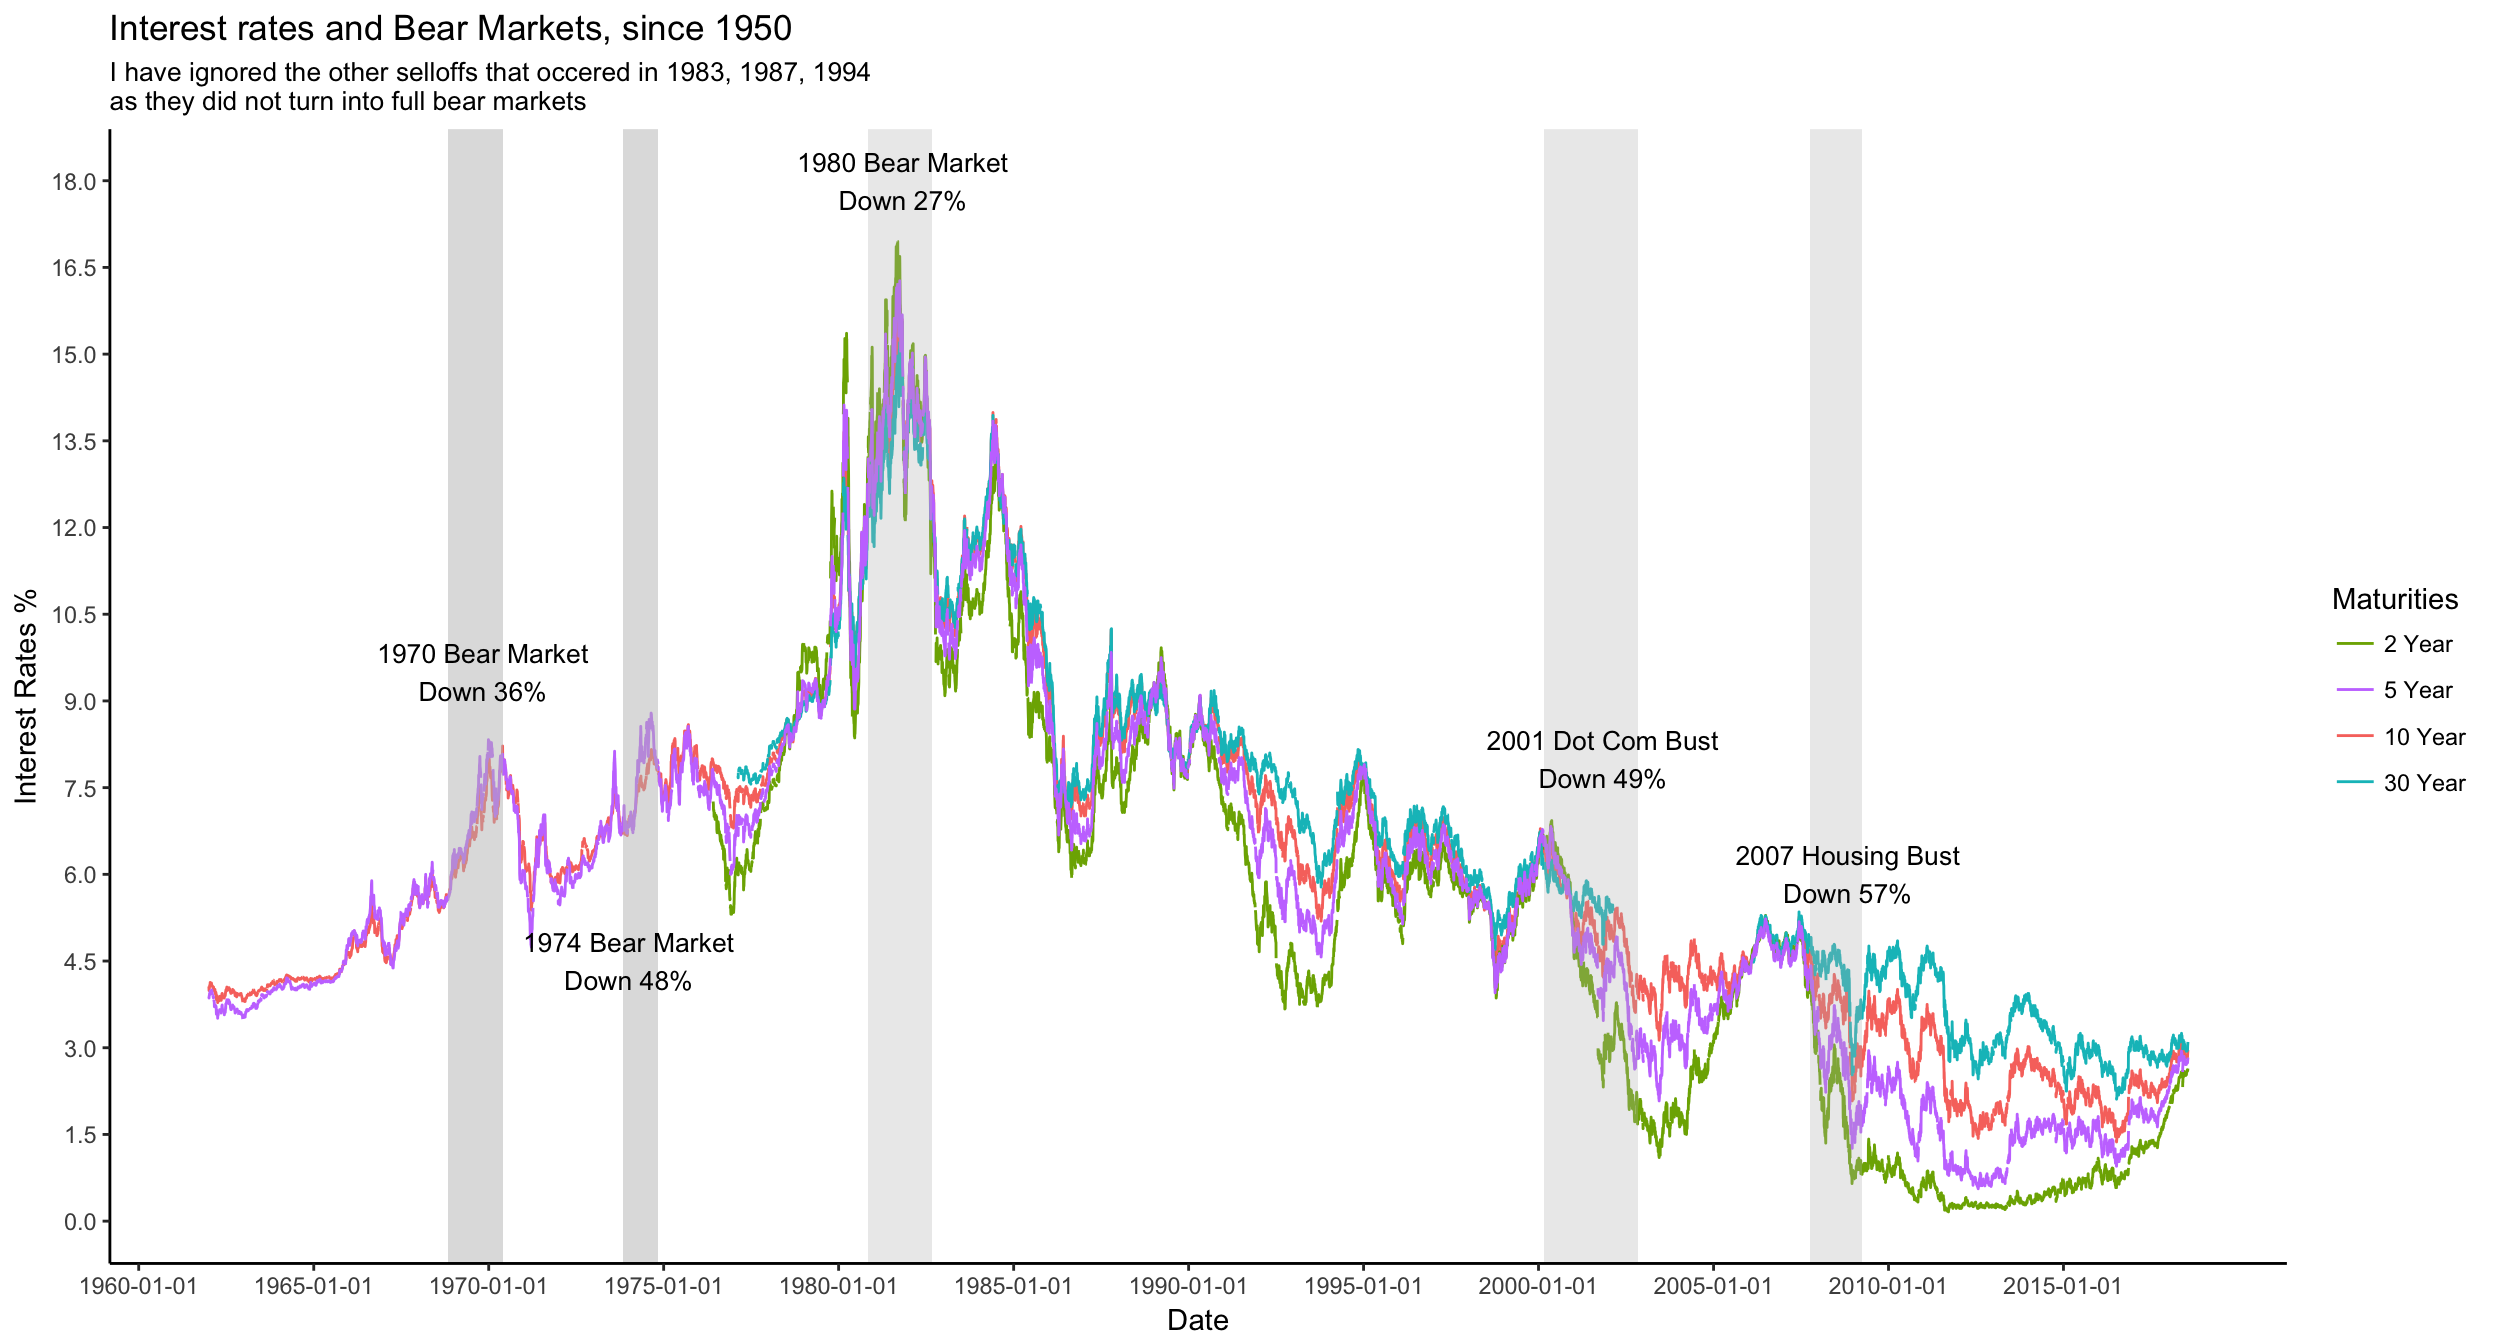
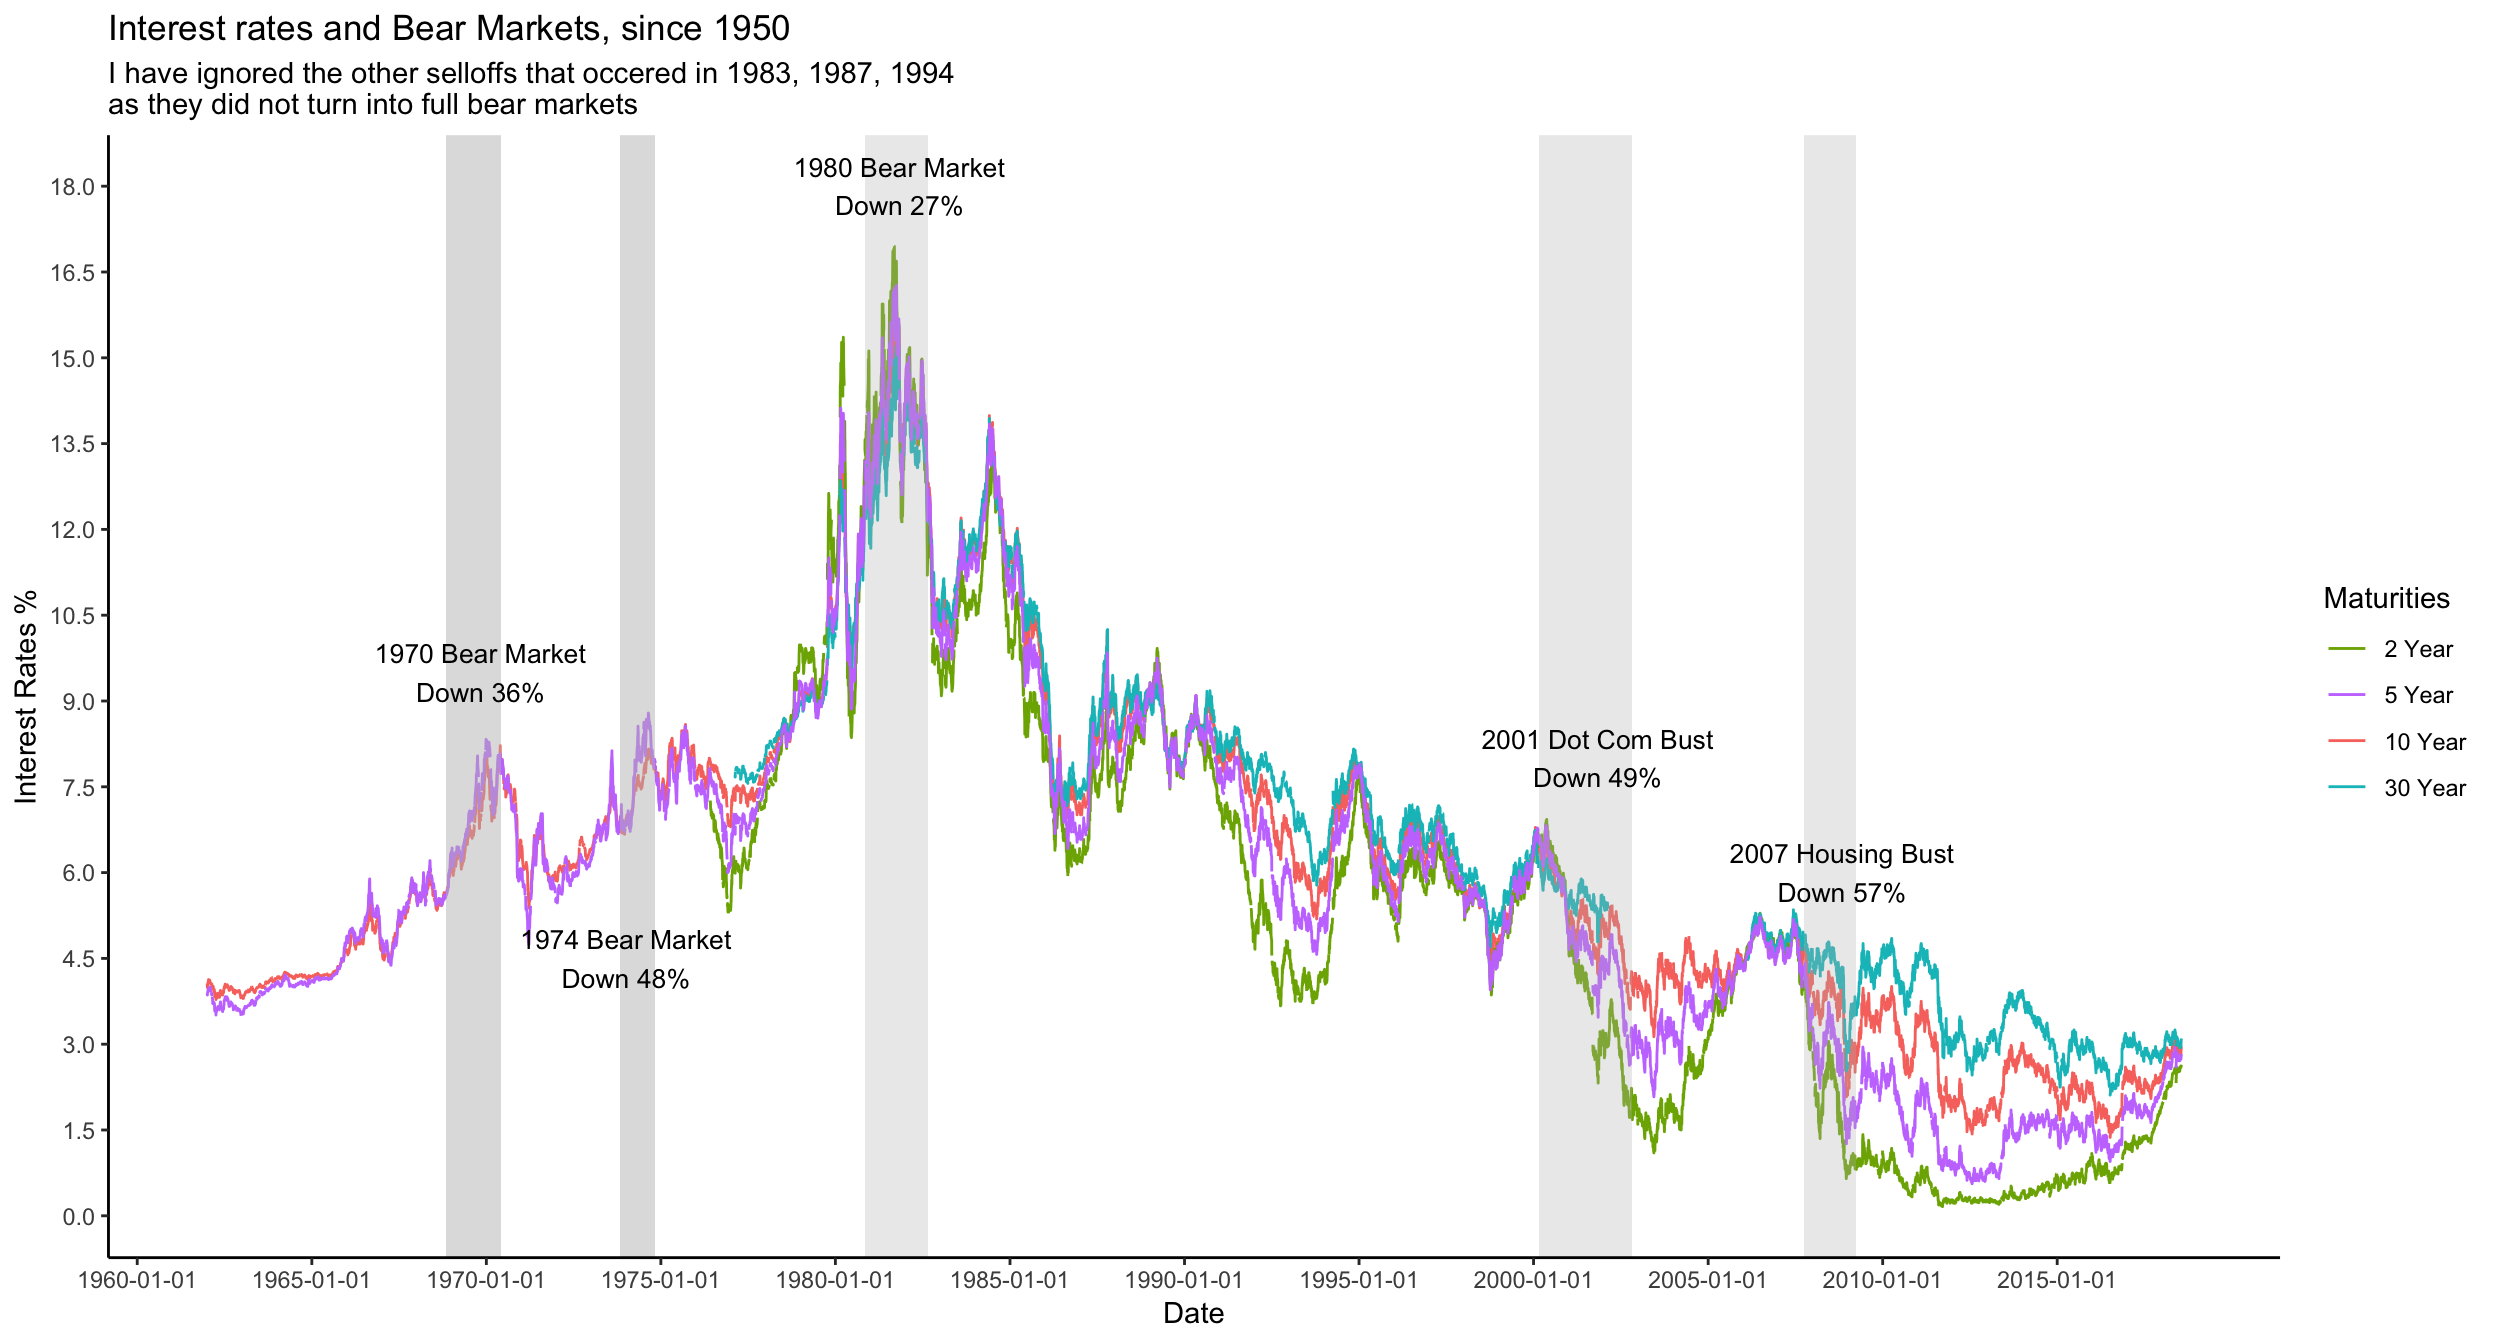
In fact the pattern of rising interest rates and tighter spreads have preceded past bear markets. In the below chart you can see the interest rates since 1950. We can observe that interest rates rise and spreads get tight, before major bear markets. After the bear market, we see interest rates start to fall and spreads start to widen. The current bull market which started in March 2009 is in its 9th year. This bull market is getting mature and the conditions are getting tight. Just like a falling bridge analogy, we don’t know which event will trigger the next crisis.
What’s our solution?
We agree that conditions are getting tight, valuations are high and this bull market is mature and may be on its last phase. The biggest hurdle is predicting when the bear market will start. This is why we employ our Model to guide us. We will stay 100% in equities, until the model tell us to get out. As of last month the model overwhelmingly preferred investing in US stocks versus bonds or international stocks. Accordingly, we have directed our capital in the US markets.
It is possible that tomorrow there could be some event such as a trade war, or an actual war that could signal an end to this long bull market. At that time, when the model indicates that conditions are getting riskier, we will switch to the safety of bonds. In the mean time we will continue our current strategy.