Facebook disappoints! Stock down 20%

Yesterday Facebook reported their earnings after market hours and investors were not pleased. They sent the stock down almost 25% at one point. Right now the stock is down about 20%. We wanted to check if this was the worst performance for Facebook stock since the IPO
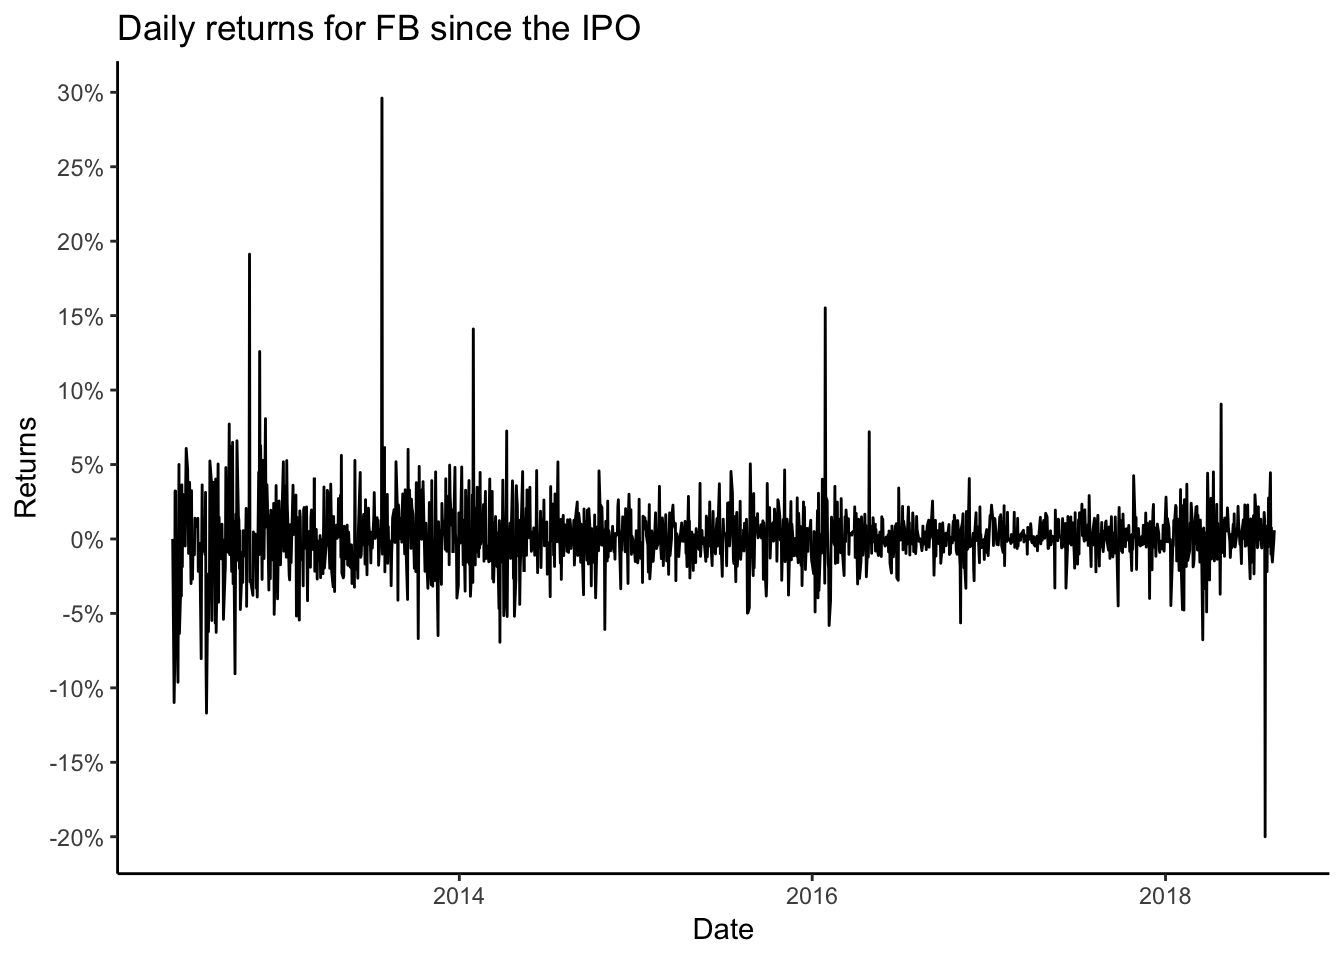
This is the worst one day performance for Facebook since its IPO. After its IPO Facebook stock was under heavy pressure and it continued to slide down for several days.
Lets see how it has performed on a 5 day rolling window.
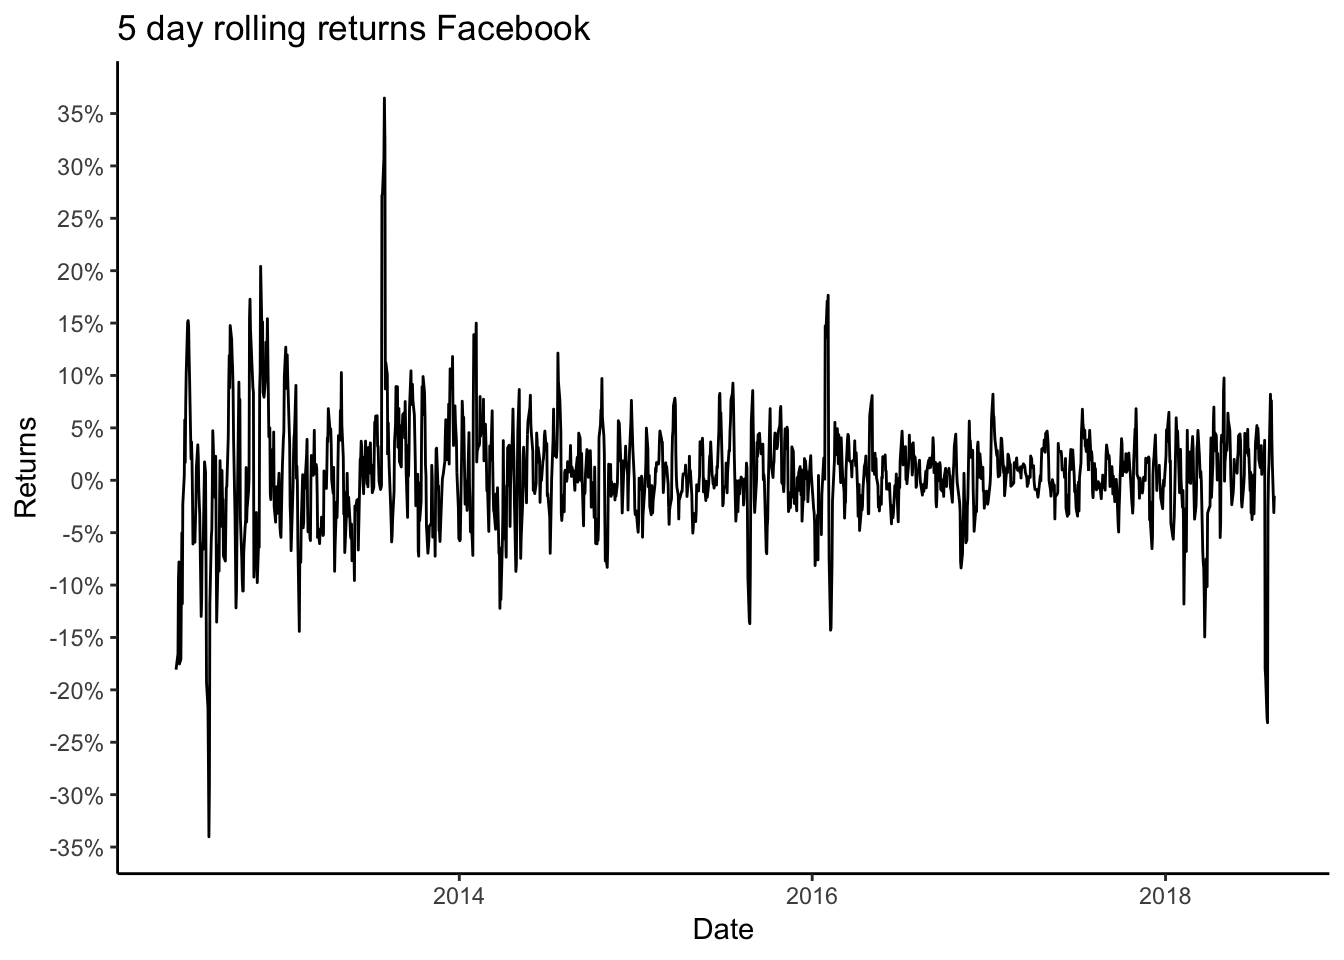
As we can see there has been worse 5 day performance for Facebook stock in the past, but majority of the time the sell off has been contained within the 15% to 20% range.
So how can one trade this event.
After such as dramatic sell off, the implied volatility of the options spike higher. One potential trade idea is to sell the volatility (be short vol).
| name | Strike | Last | Chg | Bid | Ask | Vol | OI |
|---|---|---|---|---|---|---|---|
| FB180921P00145000 | 145 | 0.66 | 0.57 | 0.65 | 0.67 | 876 | 3409 |
| FB180921P00150000 | 150 | 1.07 | 0.96 | 1.06 | 1.09 | 6732 | 16497 |
| FB180921P00155000 | 155 | 1.67 | 1.52 | 1.66 | 1.70 | 4742 | 9087 |
| FB180921P00160000 | 160 | 2.60 | 2.38 | 2.58 | 2.59 | 7256 | 10650 |
| FB180921P00165000 | 165 | 3.87 | 3.49 | 3.80 | 3.95 | 5132 | 7868 |
Above we can see the put option chain for Facebook for September 2018.
Selling the 165/160 vertical would yield approx $1.27 on a $5 spread. It does not look attractive at this moment. So we would wait at this moment. It is possible that Facebook may fall further in the coming days towards $160 range. At that time we may consider the 155/150 spread.
At this moment the $1.27 is not enough compensation to take this risk. So we will continue to monitor this stock.