S&P 500 potential bottom
Traders have many trading philosophies. Some trade on fundamental data such as revenue, earnings, cash flows etc. Whereas others trade on technical data. These traders look at chart patterns to “predict” the future direction of the market.
Since there are many traders that ascribe to technical analysis, we must pay attention when markets display some prominent chart patterns.
One such chart pattern is currently being formed in the markets. Its called the cup and handle chart pattern.
Investopedia provides a great explanation of the cup and handle formation - see below
:max_bytes(150000):strip_icc():format(webp)/CupandHandleDefinition1-bbe9a2fd1e6048e380da57f40410d74a.png)
The stock markets suffered a massive crash in March 2020 and it looks like we may have a potential bottom and reversal process underway.
This pattern is being displayed in all the major US equity markets (except Russell 2000). Russell 2000 appears to be the weakest of of all the majot US equity markets.
We can see below the S&P 500 futures chart. It is displaying a cup and handle pattern.
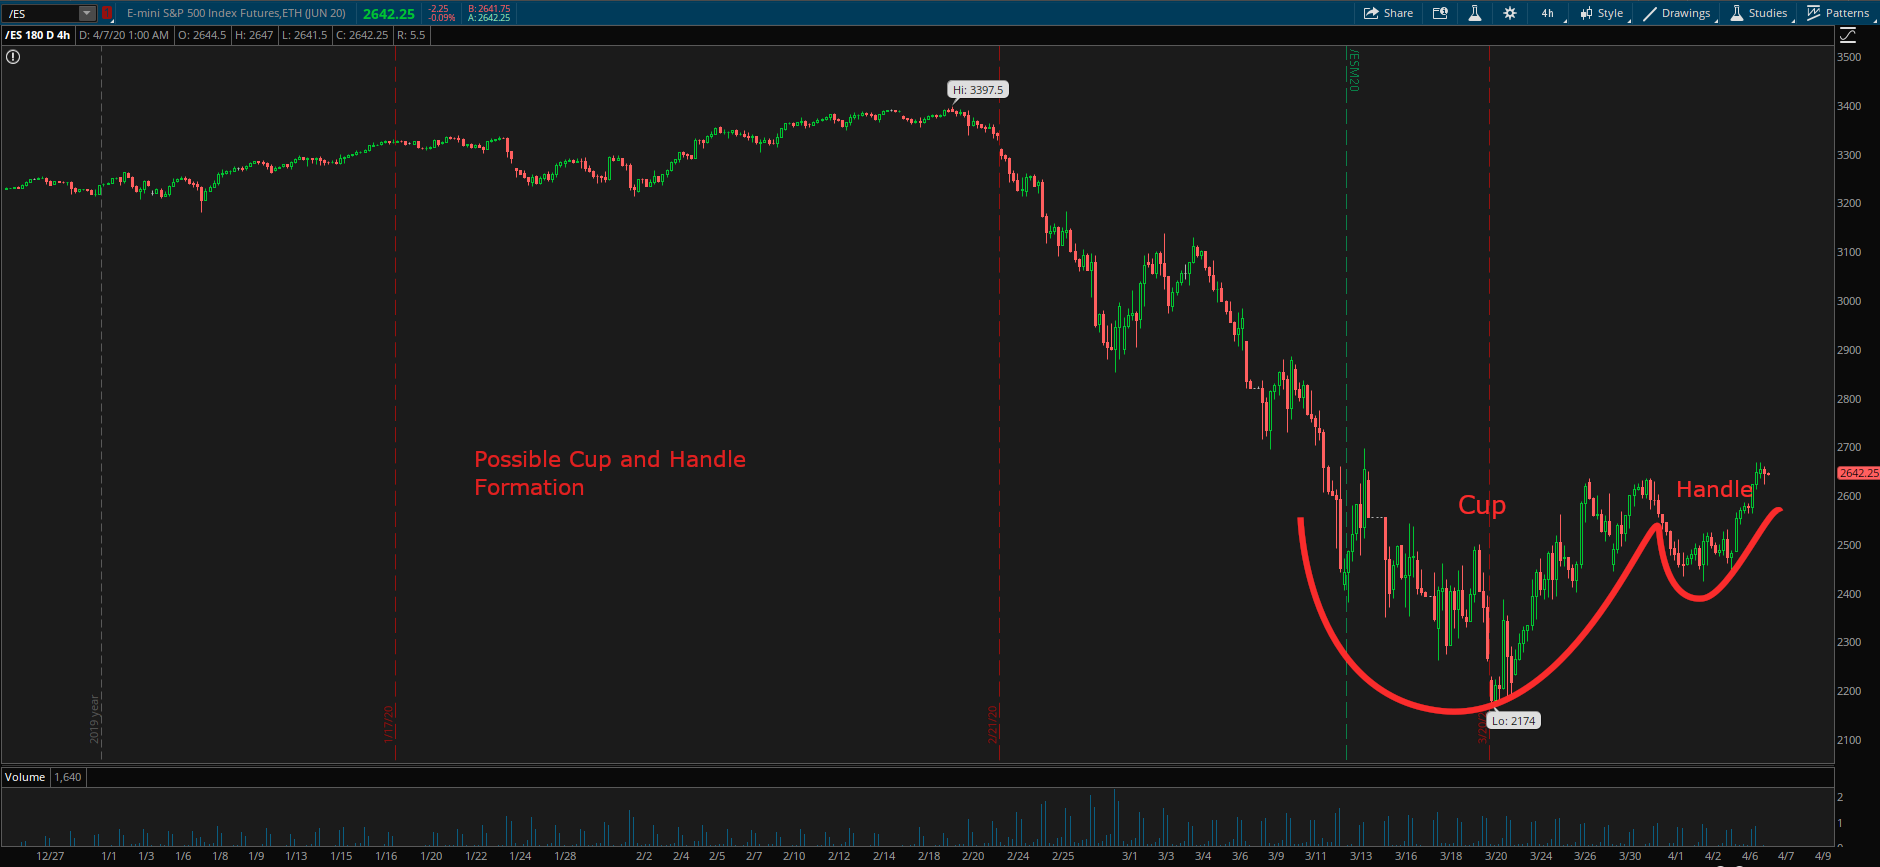
S&P 500 Futures
We still have major resistance in the 2650 to 2730 area. If we clear this area, then we may expect to see some short covering rally in the markets.
Two things that could help us clear the resistance area are:
- A significant slowdown in the number cases and death caused by the coronavirus
- A truce between Saudi Arabia and Russia
Our potential targets (assuming we clear the resistance area) could be:
Target 1 - 2900
Target 2 - 3100 (If target 1 is confidently cleared)
Summary
- The markets have suffered massive losses since the February high
- The US government and the Fed has provided a big stimulus package to support the market
- We still have some resistance, but these can be cleared easily if we get some positive news on (the coronavirus and oil war truce)
- The bears have made a lot of money in a short amount of time, and they may be keen to close their trade.
- This could help with a potential short cover rally in the markets.