S&P 500 Analysis
How has S&P 500 performed so far in 2018. We can start by looking at the S&P 500 chart below.
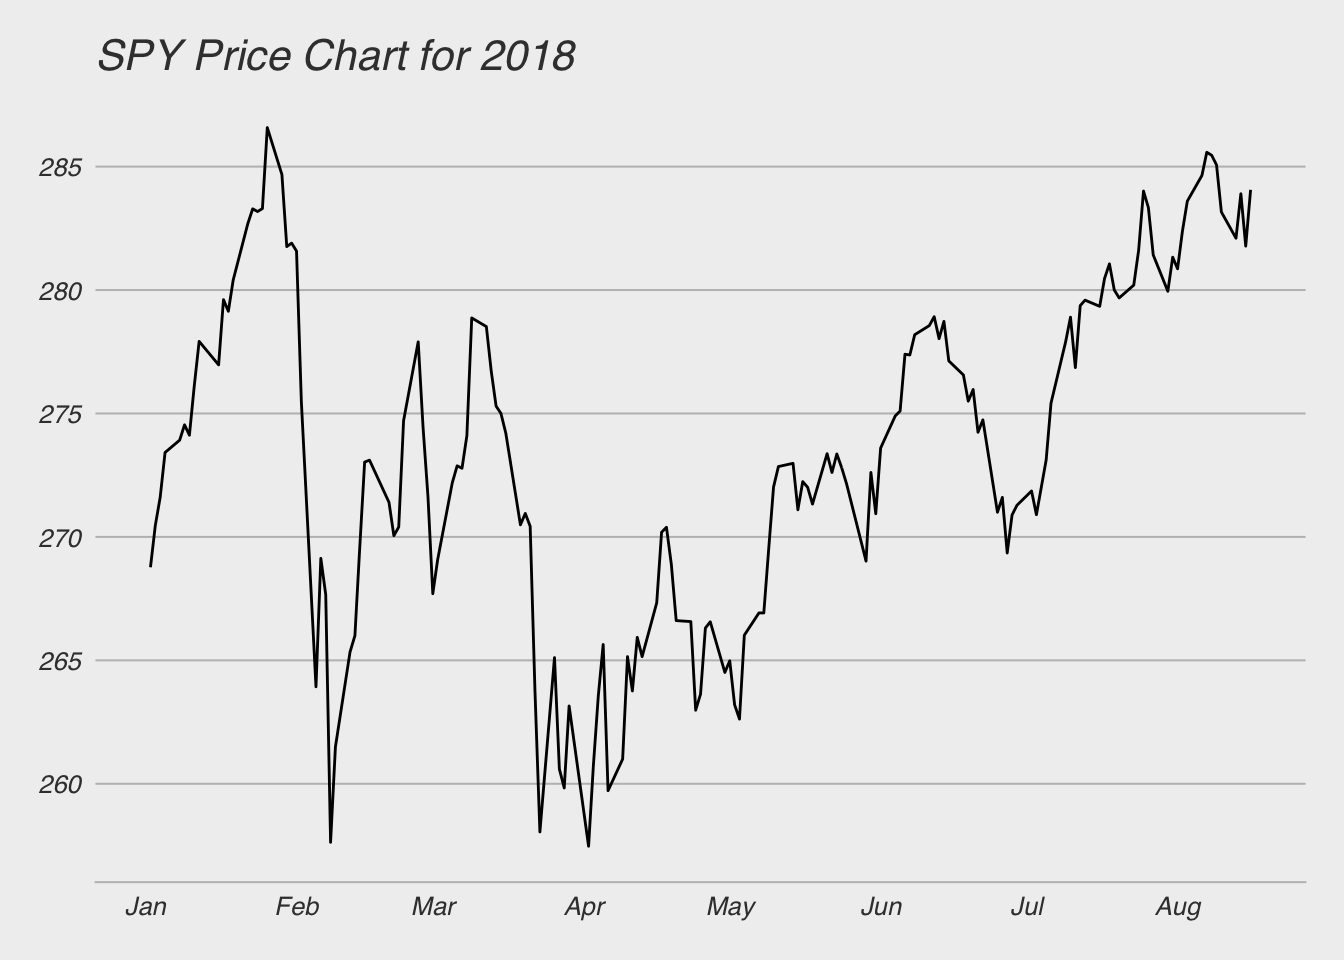
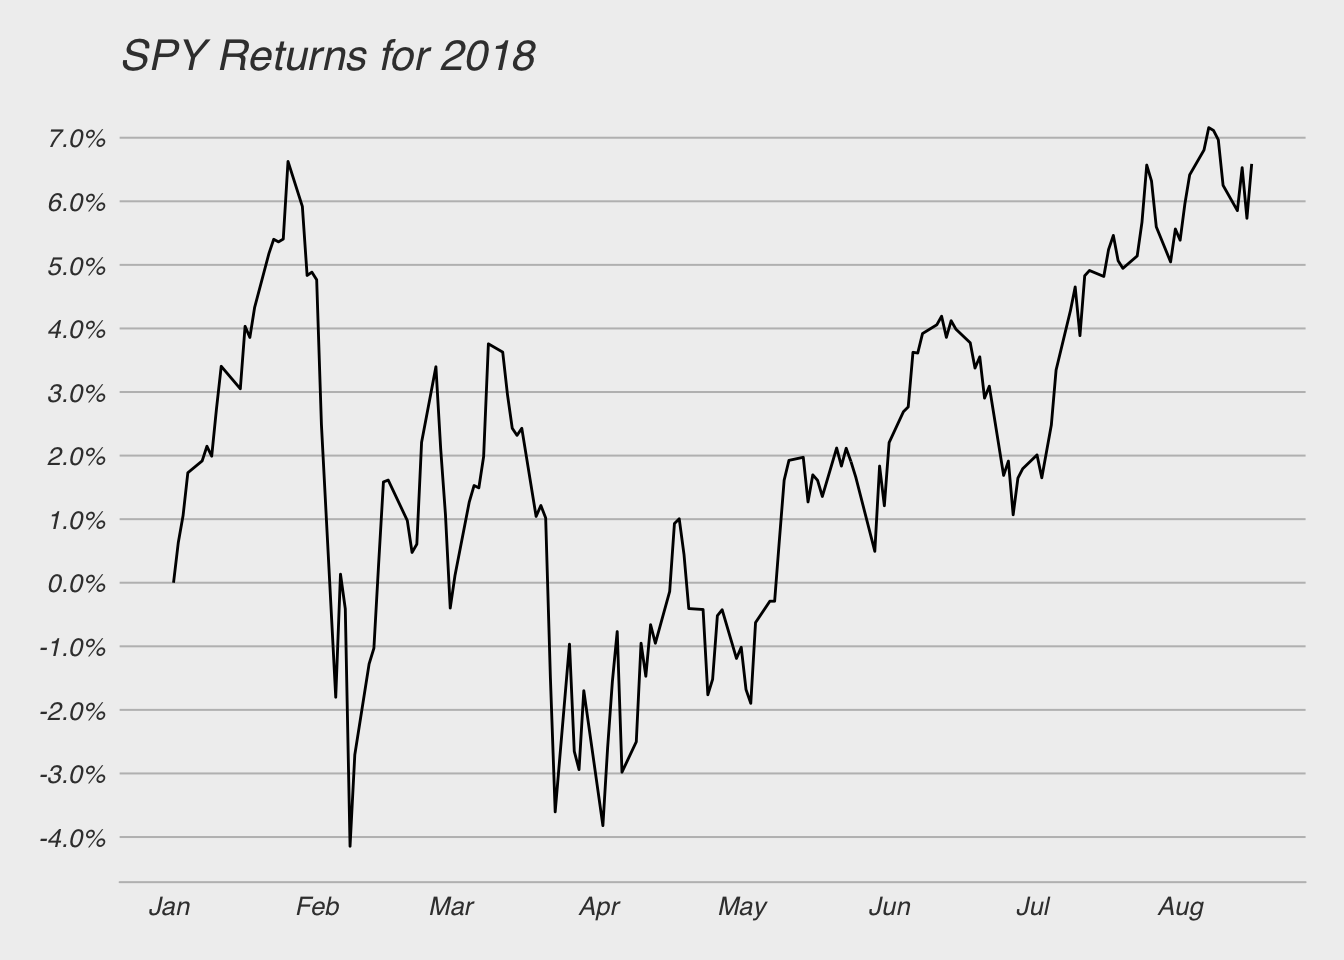
We can see from the chart that the S&P 500 is up about 6.5% since January. The price action in this chart has been sideways. We are stuck in a range 250 and 285. After big gains in 2017 the market seems to be consolidating at these new all time highs.
Next we can take a look under the hood and see how different S&P 500 components have been performing this year.
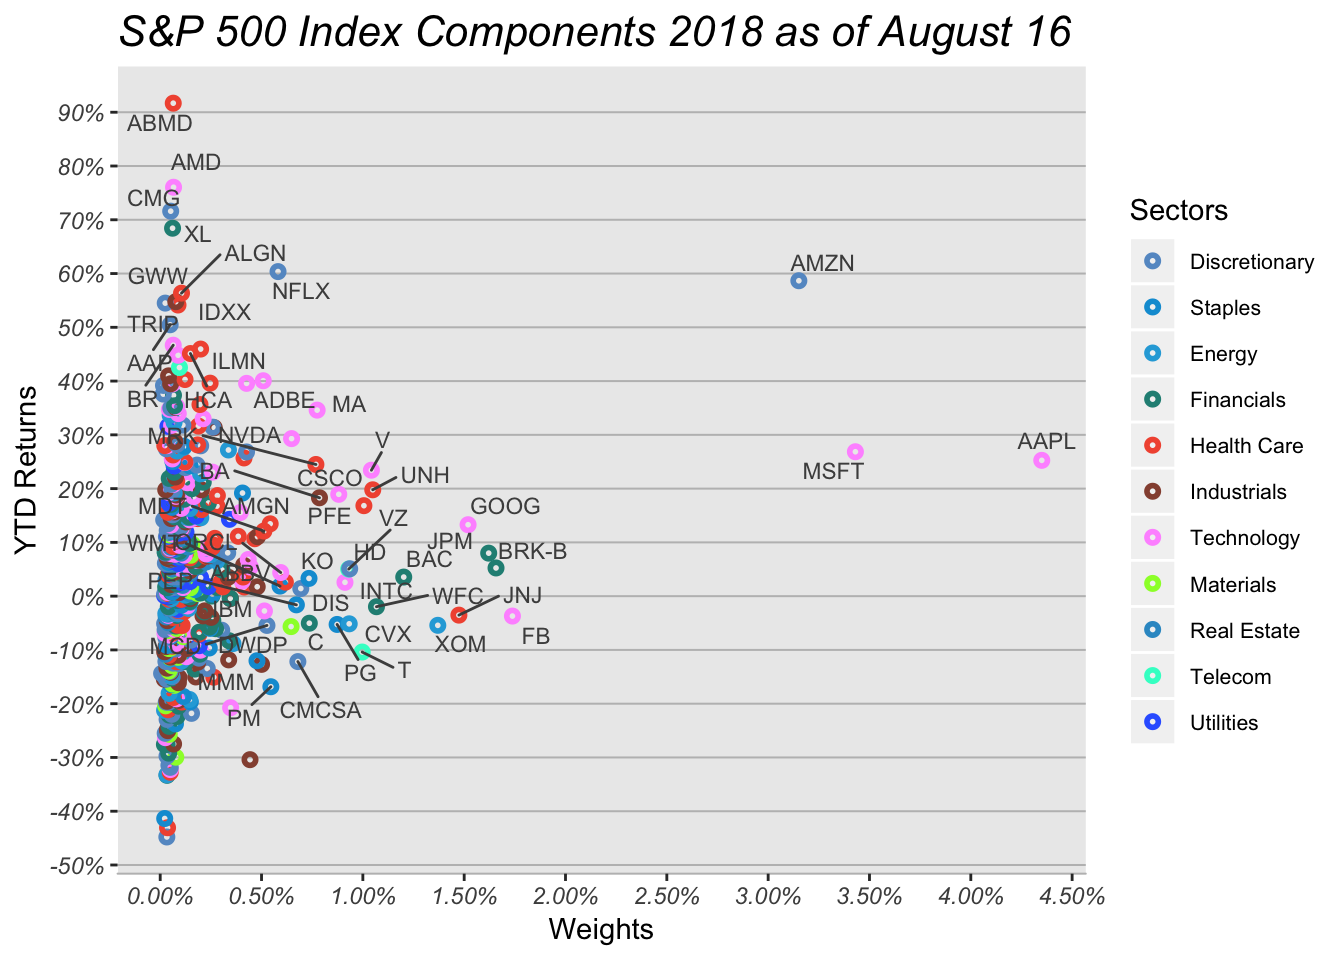
We can see from the chart Amazon, Microsoft and Apple have above 3% weighting in the S&P 500. All three stocks are outperforming the market as a whole. We can see that Amazon and Netflix are both up nearly 60% this year. The other best performing stocks so far this year are Abiomed, AMD, Chipotle, WW Grainger, Trip Advisor, Align Technology and XL Group (XL Group was purchased by AXA this year).
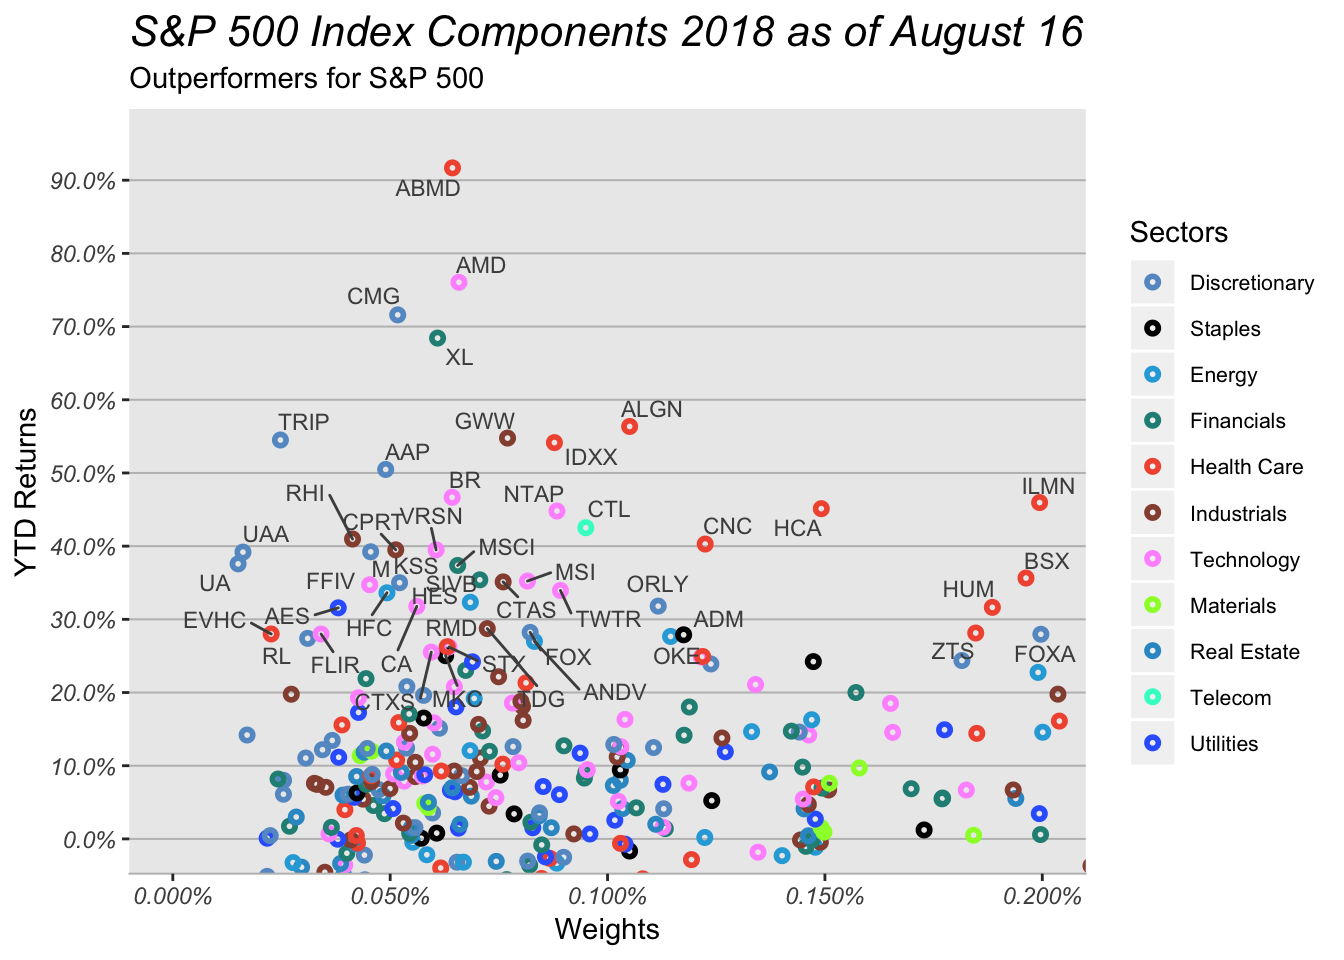
There are many other small cap stocks that are outperforming this year which are not visible in this chart. We can zoom on that area to find out those stocks.

This gives us a better view of the stocks with less than 0.2% weight in the S&P 500. We can draw a few conclusion from this chart.
- Health Care stocks have performed better as a group
- Consumer Discretionary stocks had a bad 2017, but this year they have made a strong comeback. Auto parts stocks, restaurants and retail stocks seemed to have reversed the trend
- Utilities and Consumer Staples are under performing other sectors.
Next we can look at the stocks that are showing negative returns for the year.
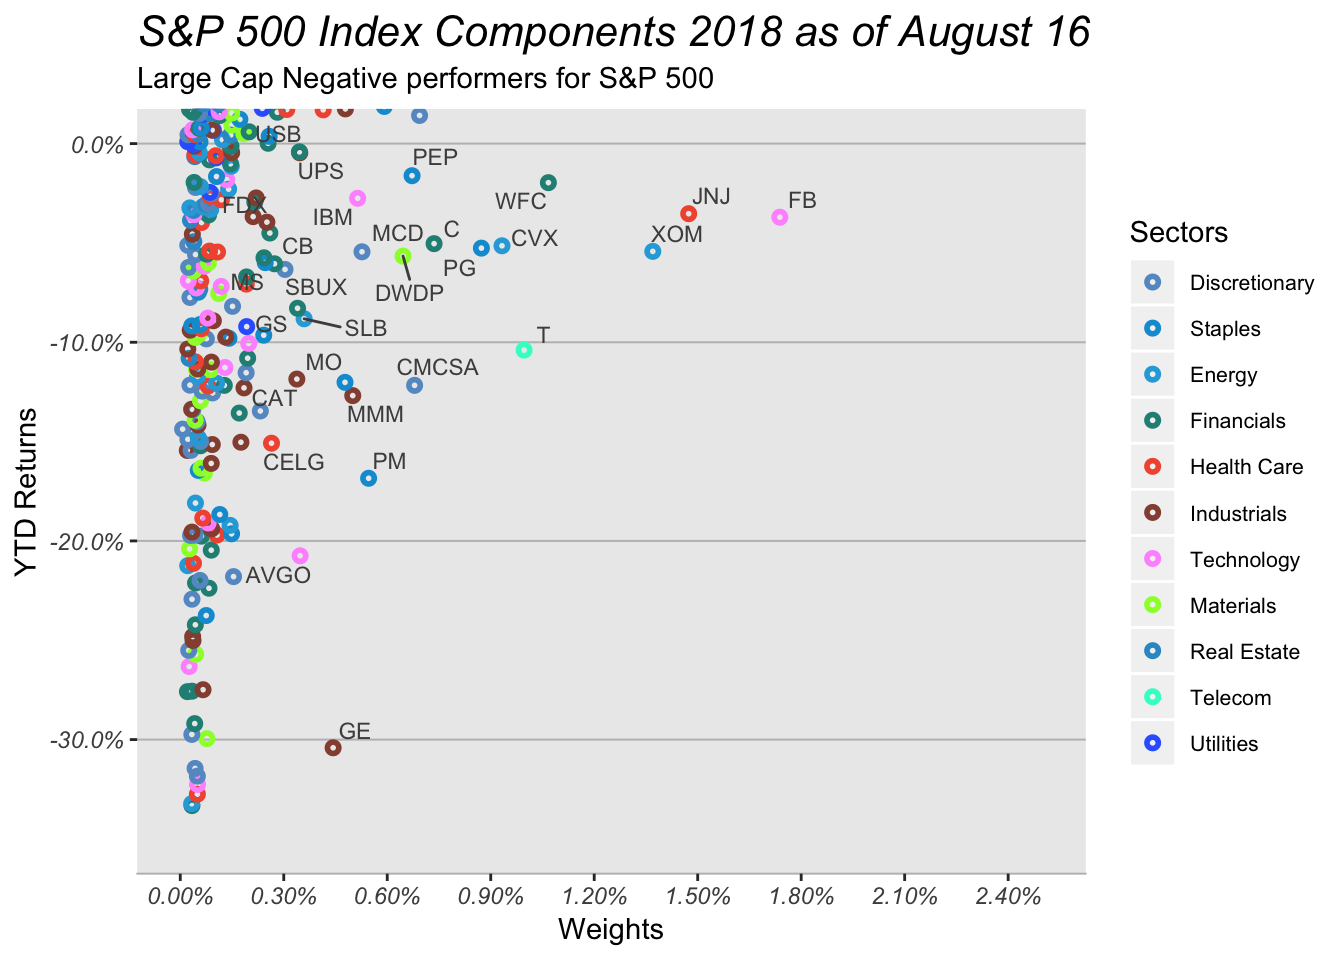
In this chart we see a mixed bag. Its not surprising to know that the stocks here are having issues of some form or another. Facebook is dealing with the privacy issue. Johnson and Johnson was fined for the talcum powder causing cancer claims. Wells fargo was fined again. GE is having many issues regarding its businesses.
Finally we will see the top contributors and detractors.
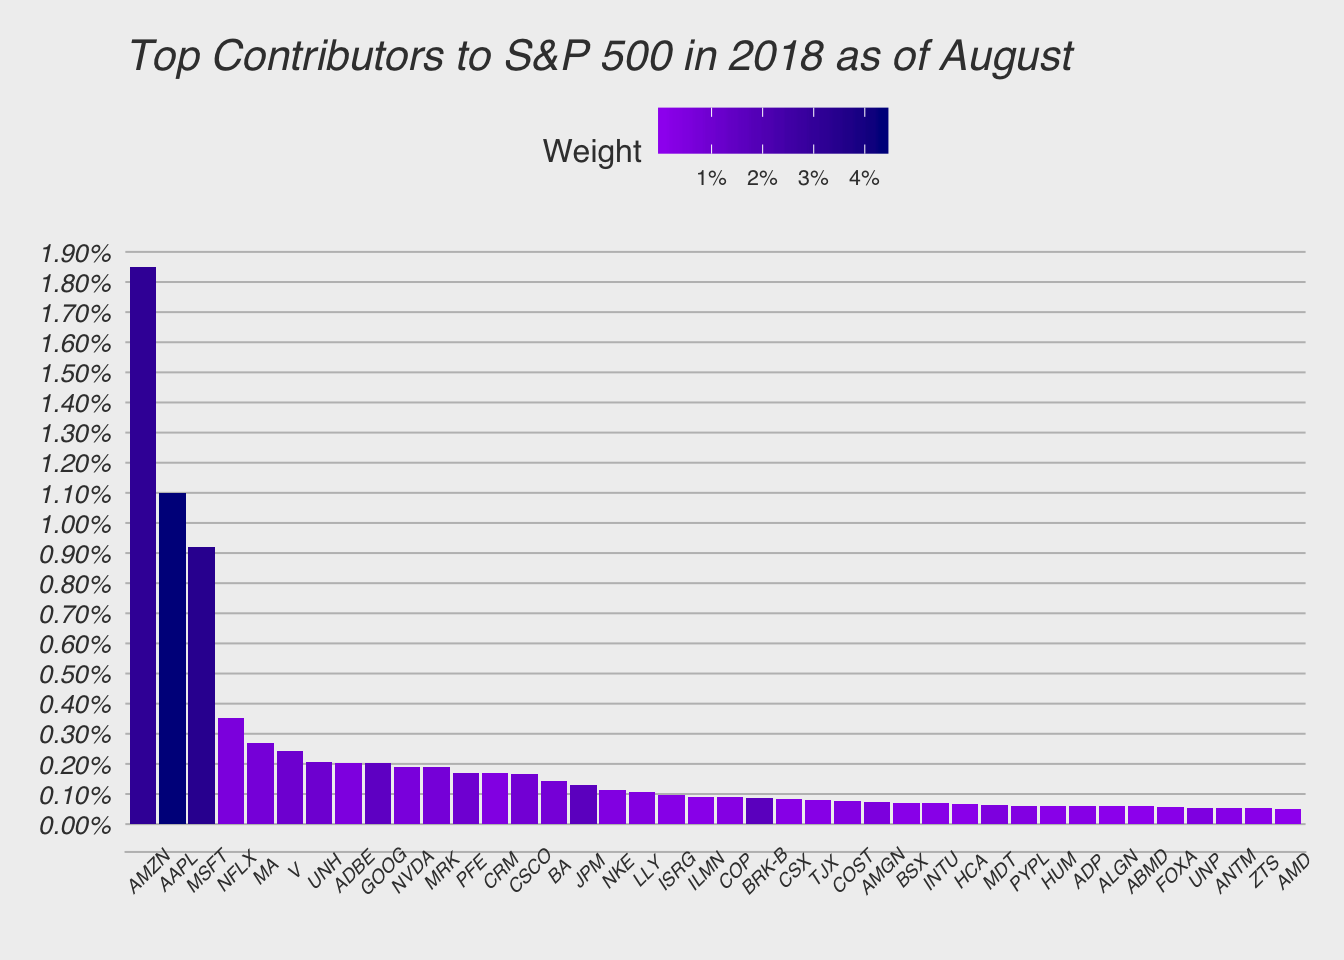
This chart is revealing. It shows us who is doing the heavy lifting for the S&P 500. We saw earlier that S&P is up about 6.5% and Amazon, Apple, Microsoft and Netflix together are responsible for about 4% of that returns. Only 4 stocks are responsible for 60% of the returns. Any manager who did not own these stocks has probably underperformed this market. This is revealing and some may argue a cause for concern.
Let us look at the top detractors from the S&P 500
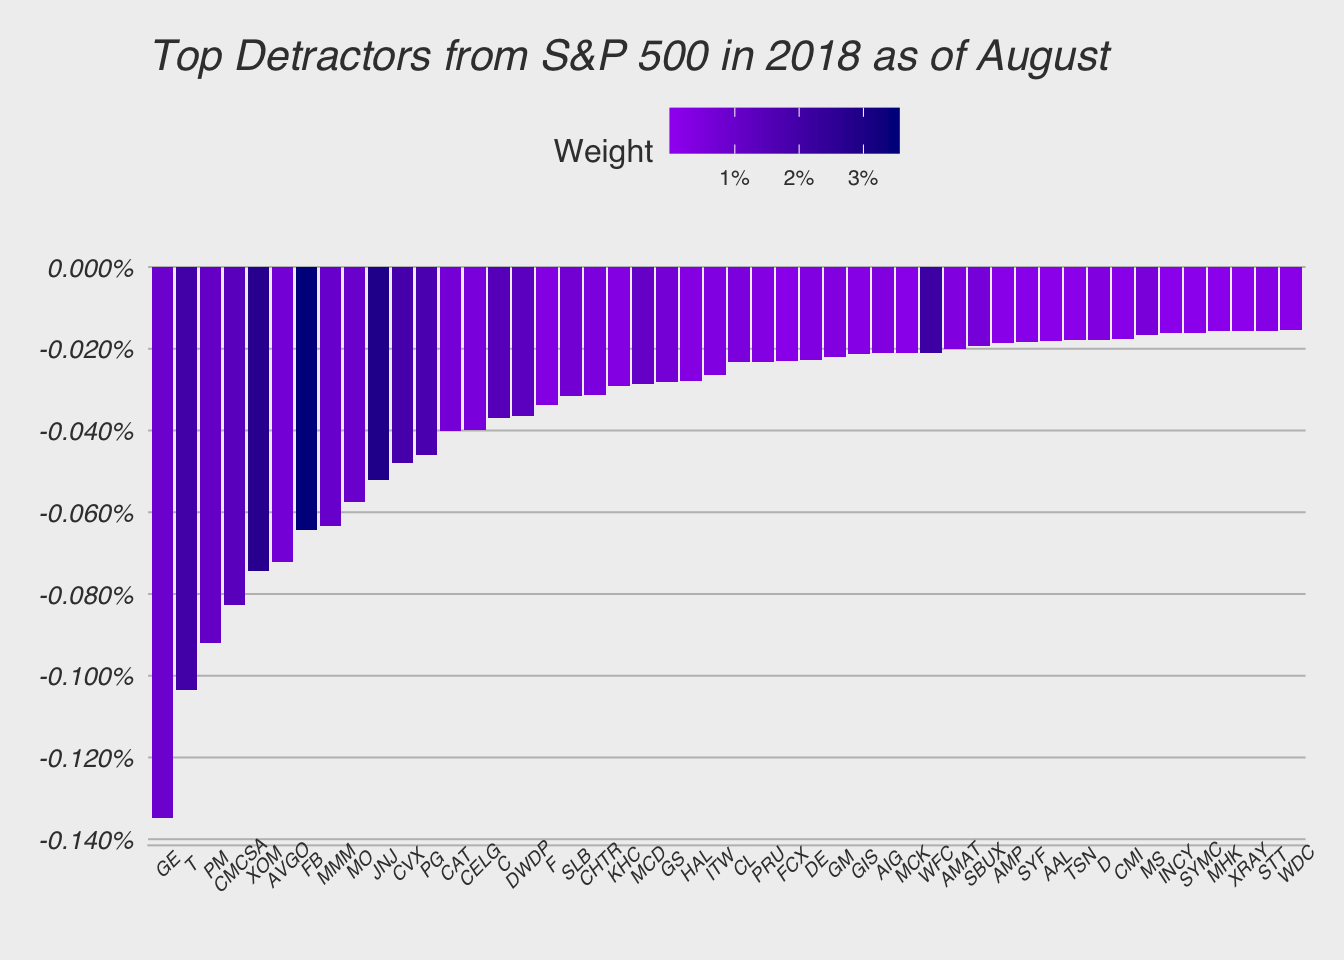
Here we can see that GE is the largest detractor this year, but there are also names such as Facebook, McDonalds, Exxon Mobile and Johnson and Johnson with negative contributions.
In conclusion, the S&P 500 is consolidating and still looking for a direction. It is range bound within 300 point or about 10% range. We are currently near the high end of the range. So far this year only a handful of companies have contributed to S&P 500’s gains. In order for S&P 500 to break out we will need to see companies such as FB, JNJ, MCD, XOM, T etc to start moving higher. On the other had if AMZN, AAPL and Microsoft start moving lower then, breaking out of this range will be difficult.